MicroReact
Easily create Interactive web visualisations using Maps, phylogenetic trees and metadata
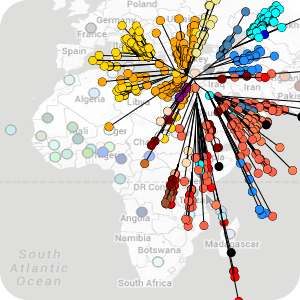
Microreact allows users to upload, visualise and explore dendrograms (trees) linked to geographic locations. Additionally, any number of metadata fields can be defined and users can specify colours and/or shapes to display on map/tree. Data without colour/shape definitions are available to display as text labels next to each tree leaf and within tables. Furthermore, if temporal data (day/month/year) are included, a time slider allows the filtering of data based on time window.
Archive Page
This page is maintained as a historical record and is no longer being updated.
About
Many sequencing pipelines exist for processing raw data. In most cases, and in particular within microbial genomics, the output are used to cluster more similar genomes in the form of a tree and the clustering patterns are used with available epidemiological, phenotypic and genotypic metadata to explore the datasets (eg outbreak investigations).
While there are many pipelines in the wild, the end points (tree / is traditionally done using static images). We developed MicroReact to provide simple intuitive online visualisations for quicker, simpler investigations, for sharing and to promote reproducibility. MicroReact provides a simple solution for data visualisation and interpretation.
Downloads
You can access MicroReact online at: http://microreact.org
Sanger Institute Contributors
Previous contributors

Professor David Aanensen
Director of the Centre for Genomic Pathogen Surveillance and Former Group Leader