
Artemis
Archive Page
This page is maintained as a historical record and is no longer being updated.
This page was archived in 2022
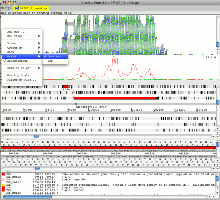
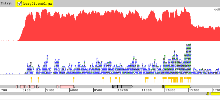
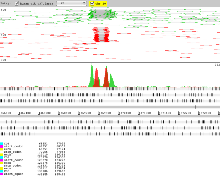
Example 1: Plasmodium falciparum 3D7
A region in chromosome 1 of Plasmodium falciparum 3D7. Displaying transcriptome data of the expression levels at two time intervals, 8 hours and 24 hours. The sequence, annotation and BAM alignment files can be launched in Artemis (please see our GitHub page for download and installation instructions).
When this example has launched, right click on the BAM view and open the coverage plot from the ‘Graph’ option in the pop-up menu. This shows the different levels of expression at 8 hours (red) and 24 hours (green). As well as the differences in expression at different times this example also confirms the annotation of the exon boundaries.
Example 2: Chlamydia trachomatis
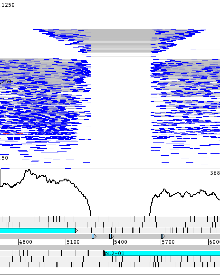
The Chlamydia trachomatis genome and plasmid are concatenated together in this example. It can be seen from the reads mapped to the plasmid sequence that there is a deletion of ca. 370 bp in the variant of this organism. The deletion removes the primer binding site used in the standard diagnostic test. This led to a significant increase in cases of what is now called the new variant C. trachomatis in Sweden where it is found.
Changing the view to plot the reads by their inferred size shows the characteristic increase in this value for the reads where they span the deleted region in the variant. This view is illustrated in the image below.
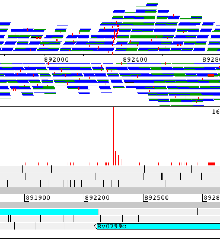
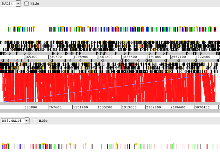
Example 3: Mycobacterium tuberculosis H37Rv
Mycobacterium tuberculosis H37Rv genome example with Illumina re-sequencing data. Right clicking on the BAM view gives an option to ‘Show’ -> ‘SNP marks’ and vertical red lines on the reads indicate differences to the reference. Additionally a SNP density plot can be shown (‘Graph’ -> ‘SNP’). Sequencing errors produce randomly distributed lines and true SNPs can be seen where lines align vertically.
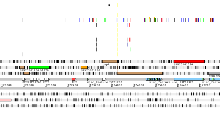
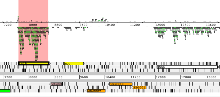
Example 4: Streptococcus pneumoniae
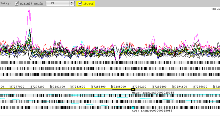
A region of Streptococcus pneumoniae antibiotic resistant pandemic clone PMEN1. This shows the variation data for 11 strains of this compared to the reference. The pspA gene in the reference is a pseudogene as a result of a frame shift. The magenta insertions in most strains show where this frame shift has been caused by a deletion in the reference strain (and one of the other strains). There are also some other points of interest – the gene has independently become a pseudogene in a second strain, because of a SNP leading to a premature stop codon, and a third strain actually has a recombination that spans this whole region (shown by the increased SNP density). For single base changes the colour represents the base it is being changed to, i.e. T black, G blue, A green, C red. Right clicking on the panel that is displaying the variation data provides a number of options including filtering and different colour schemes.
Example 5: Plasmodium berghei
An example in Plasmodium berghei of a repeat that was collapsed during the assembly. Clone the BAM panel and zoom out. Right click on the top BAM panel an change the view to show the coverage (Views -> Coverage). In the bottom BAM panel right click and use the ‘Filter’ option to hide proper pairs. There are three ways for confirming this in artemis:
- the coverage over the region is doubled
- there are heterozygous SNP in the VCF view
- the amount of reads that are not proper pairs increases at the break point of the duplication
Example 6: Salmonella bongori
An example in Salmonella bongori of directional transcriptome sequencing using Illumina technology. When launched change the view to ‘Strand Stack’ (right-click: Views -> Strand Stack). For this protocol, the reads indicating the direction are on the opposite strand.
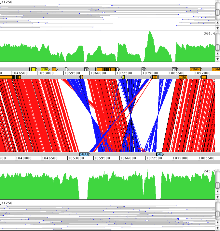
Example 7: Plasmodium berghei
An example in Plasmodium berghei of a misassembly shown in ACT (included in the Artemis tool set). A BAM panel is loaded for each assembly to identify a misassembly in the top sequence in the region 1060000-1080000 bp. The bottom sequence is the de novo assembly. To speed up the display of the BAM files (over HTTP) for the ACT launch below the Illumina BAM’s contain just 10% of the reads. The view can be cloned to show a coverage plot of mapped Illumina reads and the insert size view of mapped 454 reads. In the corrected genome the coverage is more even and does not drop except in the gap regions.
Example 8: Plasmodium falciparum
Genetic crosses can be studied using ACT. In this example reads from a genetic cross are mapped against the Pf3D7 and HB3 Plasmodium falciparum chromosome 14 sequences. This shows the variations found when compared to these two sequences. This can be used to identiy crossover in the progeny.
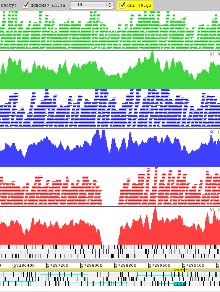
Example 9: Mouse Genomes
Artemis showing data from the Mouse Genomes Project the reference genome is loaded from an indexed FASTA file. Read alignments of 3 strains are shown in the ‘paired stack’ view with read pairs joined by a grey line. The reads are colour coded by strain with the coverage plot for each underneath. These reveal a deletion in chromosome 19 as seen from the coverage of 129S1/SvImJ (red) and not in two of the strains, A/J (green) and C57BL/6NJ (blue).
Downloading Data
- Download the Mouse Genome sequence (NCBIM37_um.fa) and the indexed fasta file (NCBIM37_um.fa.fai).
- The read alignment files (in BAM format) can be download along with their index files (*.bai). These files are large (40-140 GB) which can make them prohibitive to download locally. So an alternative is to download the region or chromosome of interest. This can be done using samtools. For example the script below can be used to download the read alignments for the 17 strains used in the Mouse Genomes Project containing just the region in chromosme 19 described above. It creates the index file for the downloaded BAM and creates a file ‘artemis_bam.list’ that can be used to load the read alignments into artemis.
/bin/bash
STRAINS=(129P2_OlaHsd 129S1_SvImJ 129S5SvEvBrd AKR_J A_J BALB_cJ C3H_HeJ C57BL_6NJ CAST_EiJ CBA_J DBA_2J LP_J NOD_ShiLtJ NZO_HlLtJ PWK_PhJ SPRET_EiJ WSB_EiJ) export REGION=19:57270000-57300000;
for strain in ${STRAINS[*]}
do
samtools view -bh ftp://ftp-mouse.sanger.ac.uk/current_bams/$strain.bam $REGION > $strain.chr19.bam;
rm -f $strain.bam.bai;
samtools index $strain.chr19.bam;
echo "$PWD/$strain.chr19.bam" >> artemis_bam.list
done
- The gene sets can be downloaded for Mus musculus. Unzip the annotation file. This file contains the annotation for the genome and needs to be sorted and indexed with tabix:
(grep ^"#" Mus_musculus.NCBIM37.64.gtf;
grep -v ^"#" Mus_musculus.NCBIM37.64.gtf | sort -k1,1 -k4,4n) | bgzip > Mus_musculus.NCBIM37.64.sorted.gtf.gz;
tabix -p gff Mus_musculus.NCBIM37.64.sorted.gtf.gz
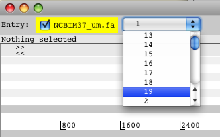
- Launch Artemis. When Artemis has been launched open the sequence file NCBIM37_um.fa. From the drop down menu in the entry panel at the top of Artemis, change the view to chromosome 19.
- Read the sorted and indexed annotation file into Artemis Mus_musculus.NCBIM37.64.sorted.gtf.gz (from the ‘File’ menu select the ‘Read An Entry’ option).
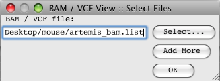
- Read the file containing the paths to the BAM files (artemis_bam.list) into Artemis (‘File’ → ‘Read BAM /VCF…’).
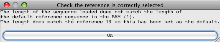
- You will then get a message to indicate that Artemis is displaying reads for Chromosome 19 (rather than the default chromosome 1).
- Navigate to the region of the BAM that was downloaded (57270000-57300000). This can be done using the Navigator (from the menus ‘Goto’ → ‘Navigator…’).
Example 10: Human Genomes – protocol for loading next-gen data
- Download the reference file from the 1000 Genomes Project.
- Unzip the downloaded reference file.
- Then download the FASTA index file.
- Download the annotation. Unzip this annotation file. This file needs to be indexed for Artemis to be able to read it. The reference names need to match the names in the sequence file (human_g1k_v37.fasta). This can be achieved by stripping out the ‘chr’ string from the first column of the gtf file (e.g. chr1 becomes 1) using this perl command:
perl -pi -e 's/^chr//' gencode_v4.annotation.GRCh37.gtf
Then this is sorted and indexed with tabix:
(grep ^"#" gencode_v4.annotation.GRCh37.gtf; grep -v ^"#" gencode_v4.annotation.GRCh37.gtf | sort -k1,1 -k4,4n ) | bgzip > gencode_v4.annotation.GRCh37.sorted.gtf.gz tabix -p gff gencode_v4.annotation.GRCh37.sorted.gtf.gz
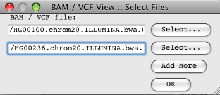
- Download some of the alignment data For example download the BAM and the associated index files of the low coverage ILLUMINA data for different samples for chromosome 20:
HG00100.chrom20.ILLUMINA.bwa.GBR.low_coverage.20101123.bam HG00100.chrom20.ILLUMINA.bwa.GBR.low_coverage.20101123.bam.bai
and
HG00236.chrom20.ILLUMINA.bwa.GBR.low_coverage.20101123.bam HG00236.chrom20.ILLUMINA.bwa.GBR.low_coverage.20101123.bam.bai
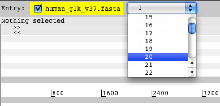
- Launch Artemis. When Artemis has been launched open the sequence file human_g1k_v37.fasta. From the drop down menu in the entry panel at the top of Artemis, change the view to chromosome 20.
- Read the annotation file into Artemis gencode_v4.annotation.GRCh37.sorted.gtf.gz (from the ‘File’ menu select the ‘Read An Entry’ option).
- Read the BAM files into Artemis (‘File’ → ‘Read BAM /VCF…’).
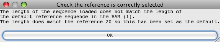
- You will then get a message to indicate that Artemis is displaying reads for Chromosome 20 (rather than the default chromosome 1).
- To differentiate reads from each BAM right click in the BAM view and select ‘Colour By’ → ‘Coverage Plot Colours’.
Usage:
Note: A minimum Java version of 1.8 is required to load the next-generation file formats.
Artemis and ACT can be downloaded and run as standalone tools and used to browse indexed BAM, VCF (Variant Call Format) and BCF (Binary VCF) files on a users local machine. Please see our GitHub page for additional information, download and installation instructions.
Artemis and ACT read BAM files that has been sorted and indexed using SAMtools. This provides an integrated BamView panel displaying sequence alignment mappings to a reference sequence (see Example 1 above).
Variant Call Format (VCF) files can also be read (see Example 3 above). The VCF files need to be compressed and indexed using bgzip and tabix respectively (see the tabix manual and download page). The compressed file gets read in (e.g. file.vcf.gz) and below are the commands for generating this from a VCF file:
bgzip file.vcf tabix -p vcf file.vcf.gz
Alternatively a BCF file can be indexed with BCFtools and read into Artemis or ACT.
As with reading in multiple BAM files, it is possible to read a number of (compressed and indexed) VCF files by listing their full paths in a single file. They then get displayed in separate rows in the VCF panel.