Workforce Equality Report 2025
Aims and purpose of the report
As part of our commitment to equality, diversity and inclusion (EDI) this is the first Workforce Equality Report produced by the Wellcome Sanger Institute. The report provides key demographic data about our staff and student populations, and helps us identify and address any disparities.
The report thus is a pivotal part of our evidence base for EDI actions, which will inform our Culture work moving forwards. It is quantitative data, around diversity, representation and disparity in Sanger’s progression and recruitment processes. This sits alongside the rich qualitative data about Sanger’s inclusion, culture and experience, which we have from various sources, including an EDI analysis of our staff survey, listening circles with marginalised groups and other staff groups, a Culture Audit, and Authority Gap interviews undertaken.
The data informs what interventions are needed and will help us target our resources towards the most pressing challenges and disparities.
Our aims in doing so are as follows:
- We seek to represent our diverse communities, as much as we can. The business case for this has been made extensively. It enables us to remain adaptable, in a world where demographics are shifting in society.
- We seek to be an exemplar employer of choice: attracting, retaining, supporting and developing the best talent. This enables us to continue to be open to new ideas and perspectives within our work.
- We seek to be inclusive and to reduce disparity and improve the quality of experience for everyone, in particular for marginalised groups. This enables us to have better teamwork.
- We seek to model best practice and support partner organisations with their endeavours towards good EDI and employment practice, within our capacity to do so, in line with our pioneering
Our intention is to reproduce the report annually, which will enable an evidence base, in terms of year-on-year comparisons, direction of travel, and accountability for progress.
For any questions about the content of the report, please contact the Culture and Inclusion team, at culture@sanger.ac.uk.
Workforce profile 2025: a snapshot of employees
Age
Disability
Gender identity
Nationality
Race
Religion and belief
Sexual Orientation
Working patterns
Disclosure rates of staff 2025
| Age: 100% (HMRC requirement) |
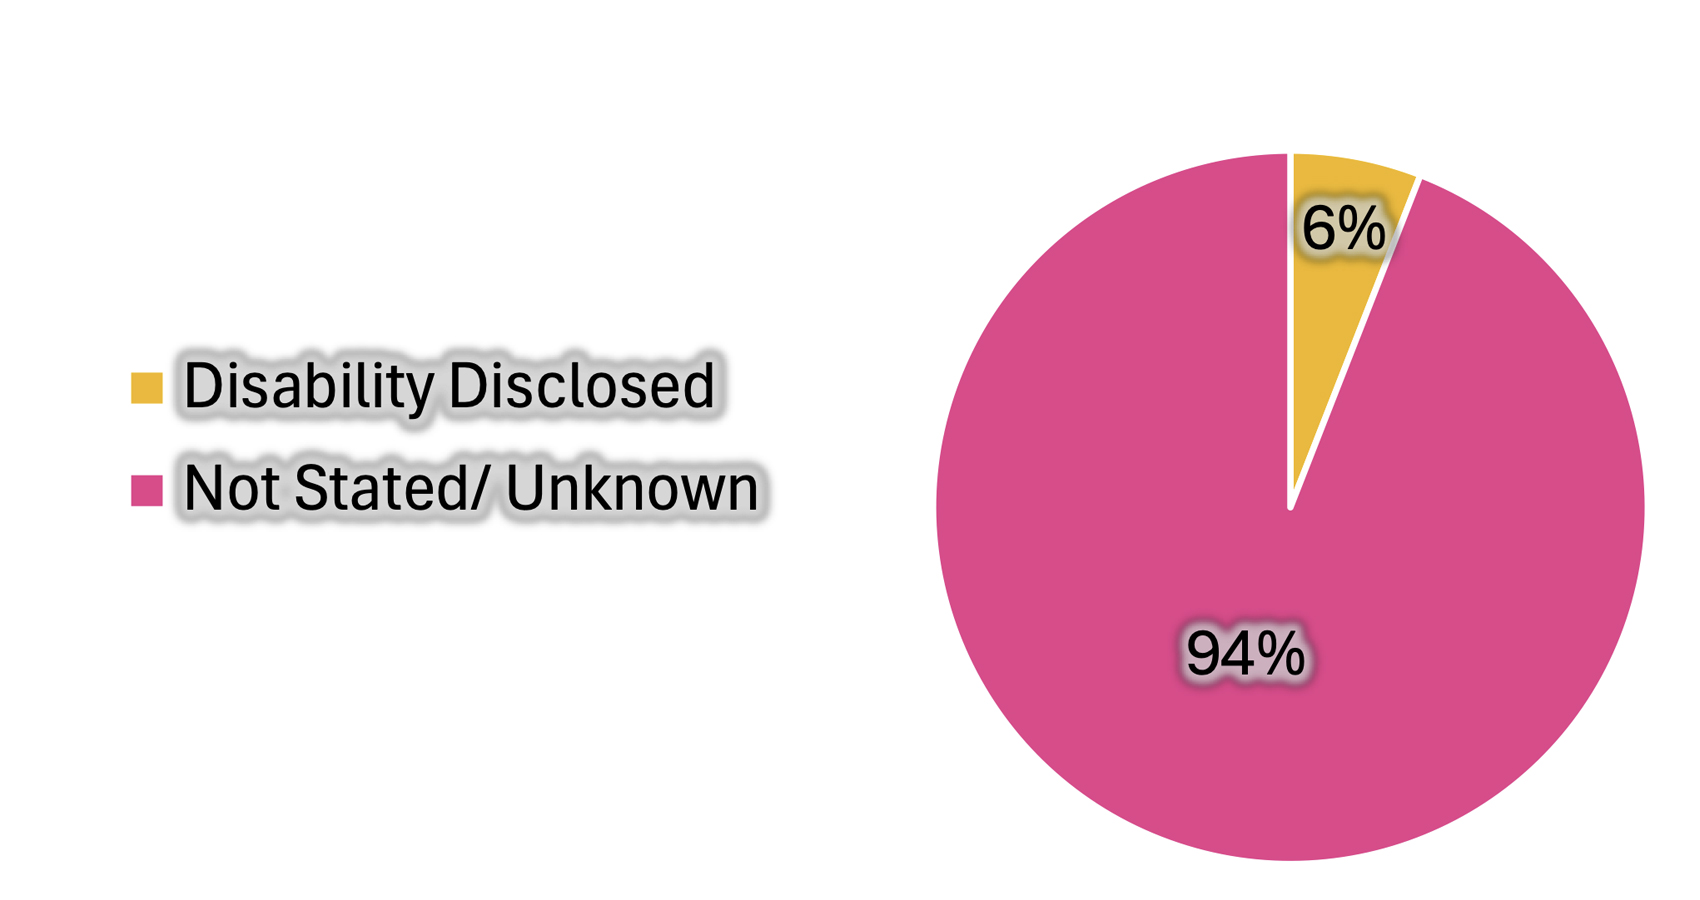
| Disability: 6% |
| Gender identity: 70.8% |
| Legal sex: 100% (HMRC requirement) |
| Race: 78% |
| Religion or belief: 67% |
| Sexual orientation: 63% |
Data/commentary and actions to consider
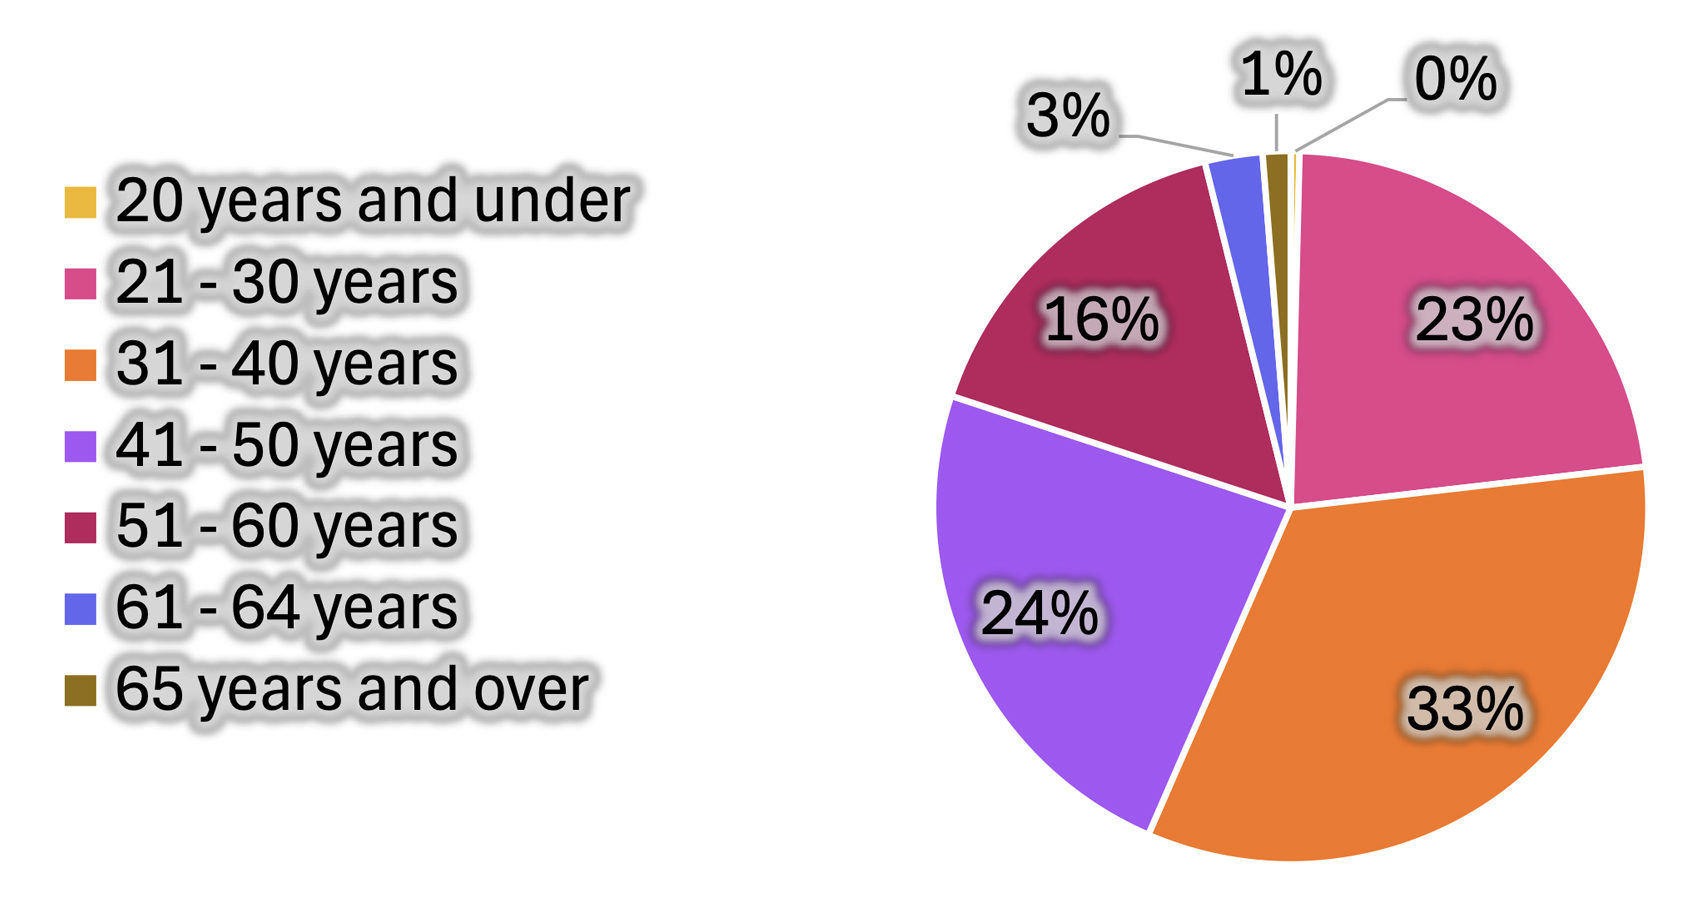
3.1 Age
Data/commentary:
The workforce peaks in the 31-40 age range, with 33 per cent of staff being in this category. 56 per cent of staff are under 40. This is comparatively younger than the wider population, where 46 per cent of those of working age are under 40.1 Despite the younger demographic, older applicants are both more likely to be shortlisted and more likely to be made an offer than younger applicants.
Actions to consider:
Whilst there may be a correlation between age and experience, a review of recruitment processes to consider any practices that may benefit older candidates disproportionately would be beneficial. Include reference to potential age bias in learning for recruiting.
3.2 Disability
Data/commentary:
- Disclosure rates for this category are hampered by there only being an option currently to disclose a disability, rather than to disclose not having a disability, or preferring not to say. Hence it being at 6 per cent disclosure, whereas all the other categories have over 60 per cent disclosure.
- Younger staff are more likely to disclose being disabled – for instance, over four times as many staff aged 21-30 disclosed a disability (9 per cent), as those aged 51-60 (2 per cent). This is despite the fact that most disability is acquired with age, and therefore the rate of disability increases with age.2
- Disabled applicants are less likely to be shortlisted, and less likely to be made an offer.
Actions to consider:
- As a matter of priority, amend HR systems to enable yes/no/prefer not to say responses to a disability question.
- Do more to ensure staff of all ages feel comfortable disclosing disabilities, and are aware of the range of support available to them.
- Review recruitment processes to consider practices that may create barriers for disabled candidates, and to improve accessibility and adjustments made during recruitment. Best practice is to have a list of adjustments that can be asked for, since many candidates do not know what they can ask for, and many recruiting managers do not know what they can offer. Include reference to disability inclusion and bias in learning for recruiting managers.
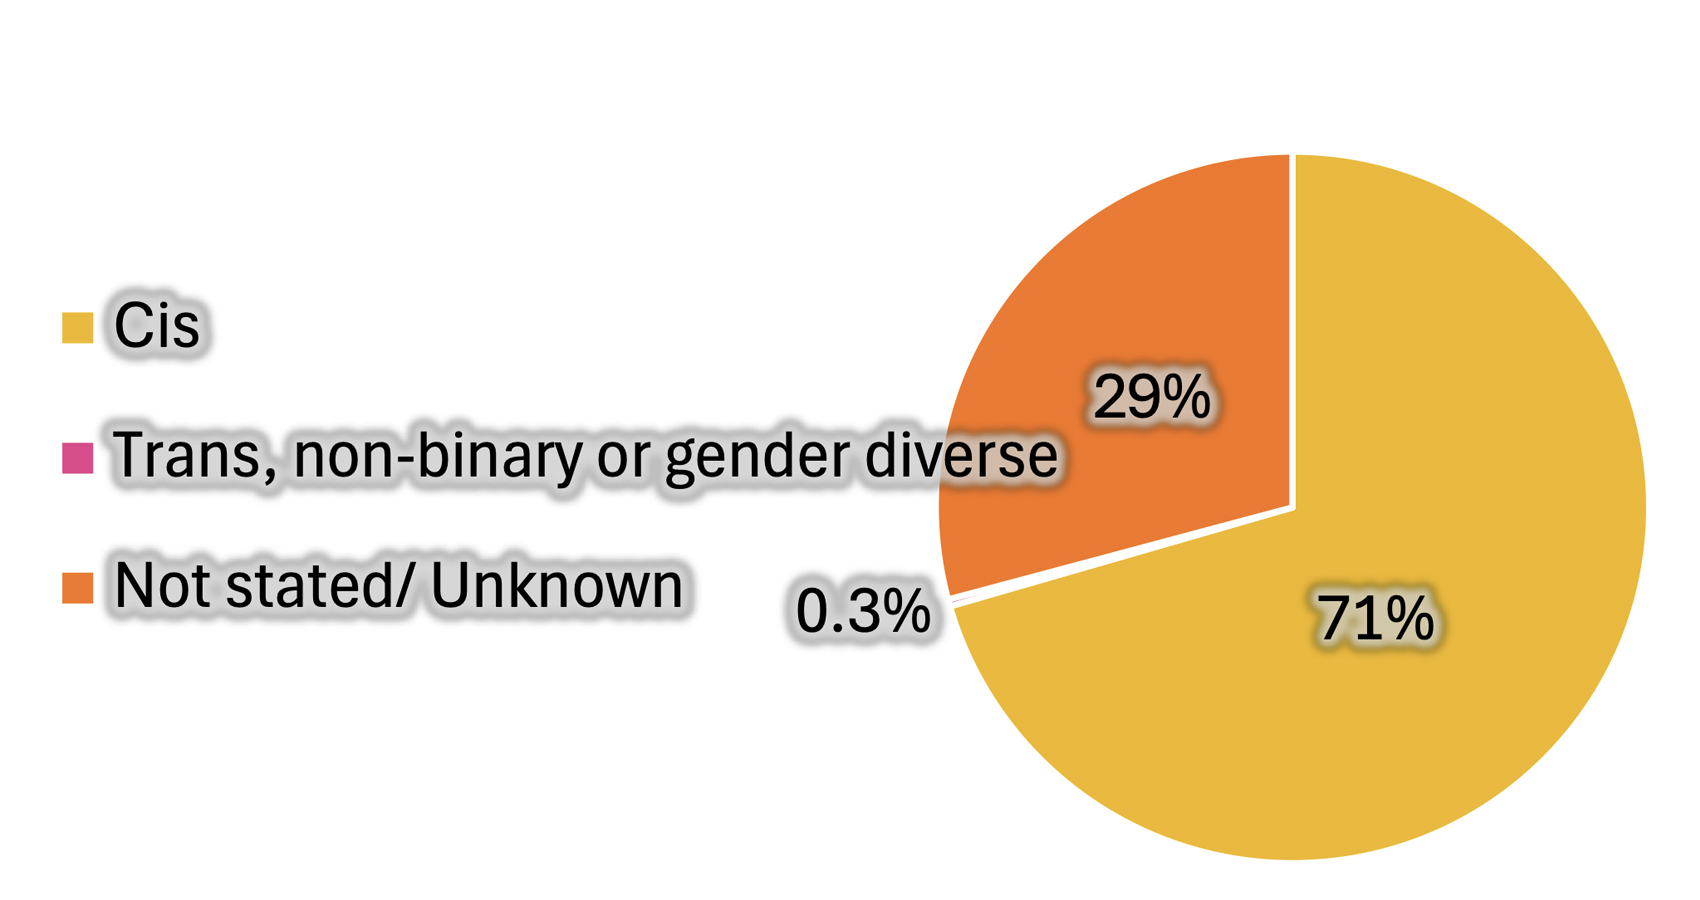
3.3 Gender identity
Data/commentary:
The gender identity declaration rate has more than doubled, from 33.7 per cent in 2018, to 70.8 per cent in 2025. This gives a higher declaration rate than for either religion/belief, or sexual orientation. That bucks a trend for modern workplaces, since this category of data collection has usually been introduced more recently and as such often has lower declaration rates.3 The relative comfort around this category echoes qualitative data collected in the organisation, indicating an appetite for trans inclusion. This is also reflected in the relatively younger staff demographic, as there are statistics around younger generations being more openly LGBTQ+.4
Actions to consider:
Build on the starting point, to increase disclosure, visibility and awareness around trans inclusion.
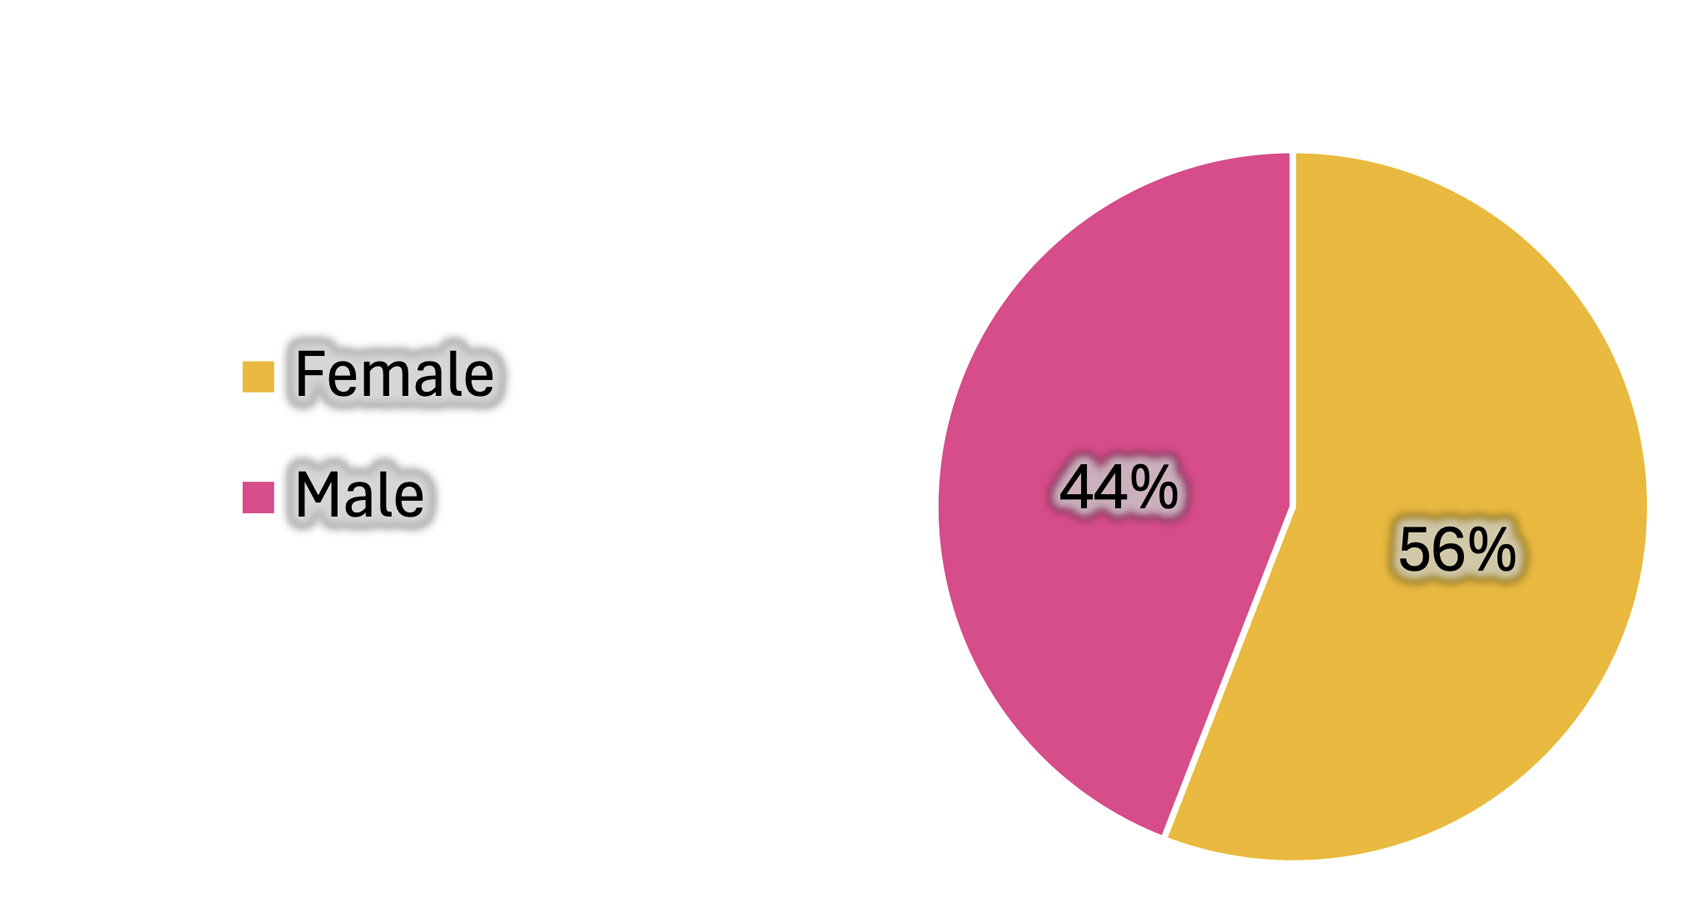
3.4 Legal sex5
Data/commentary:
- On average male employees are older than female employees; higher proportions of male employees than female employees are in the older age groups. The differences in age may point to retention issues for older women. It is known that older women are more likely to have caring responsibilities,6 and be contending with menopause as well, both of which are known to cause people to leave workforces if they are not sufficiently supported.7
- Perhaps surprisingly, given the challenges around female representation in the wider science sector,8 there is little difference between the representation of female employees in management and support roles, and in scientific roles (55.1 per cent and 56.6 per cent, respectively). However, male employees are at higher grades on average, which in part explains the Institute’s gender pay gap.
Actions to consider:
- Increase support and awareness around caring and menopause issues, to address retention issues for older women.
- Actions are identified separately in our Gender Pay Gap report, to reduce disparity in pay and progression for women in the Institute.
3.5 Race and nationality9
Data/commentary:
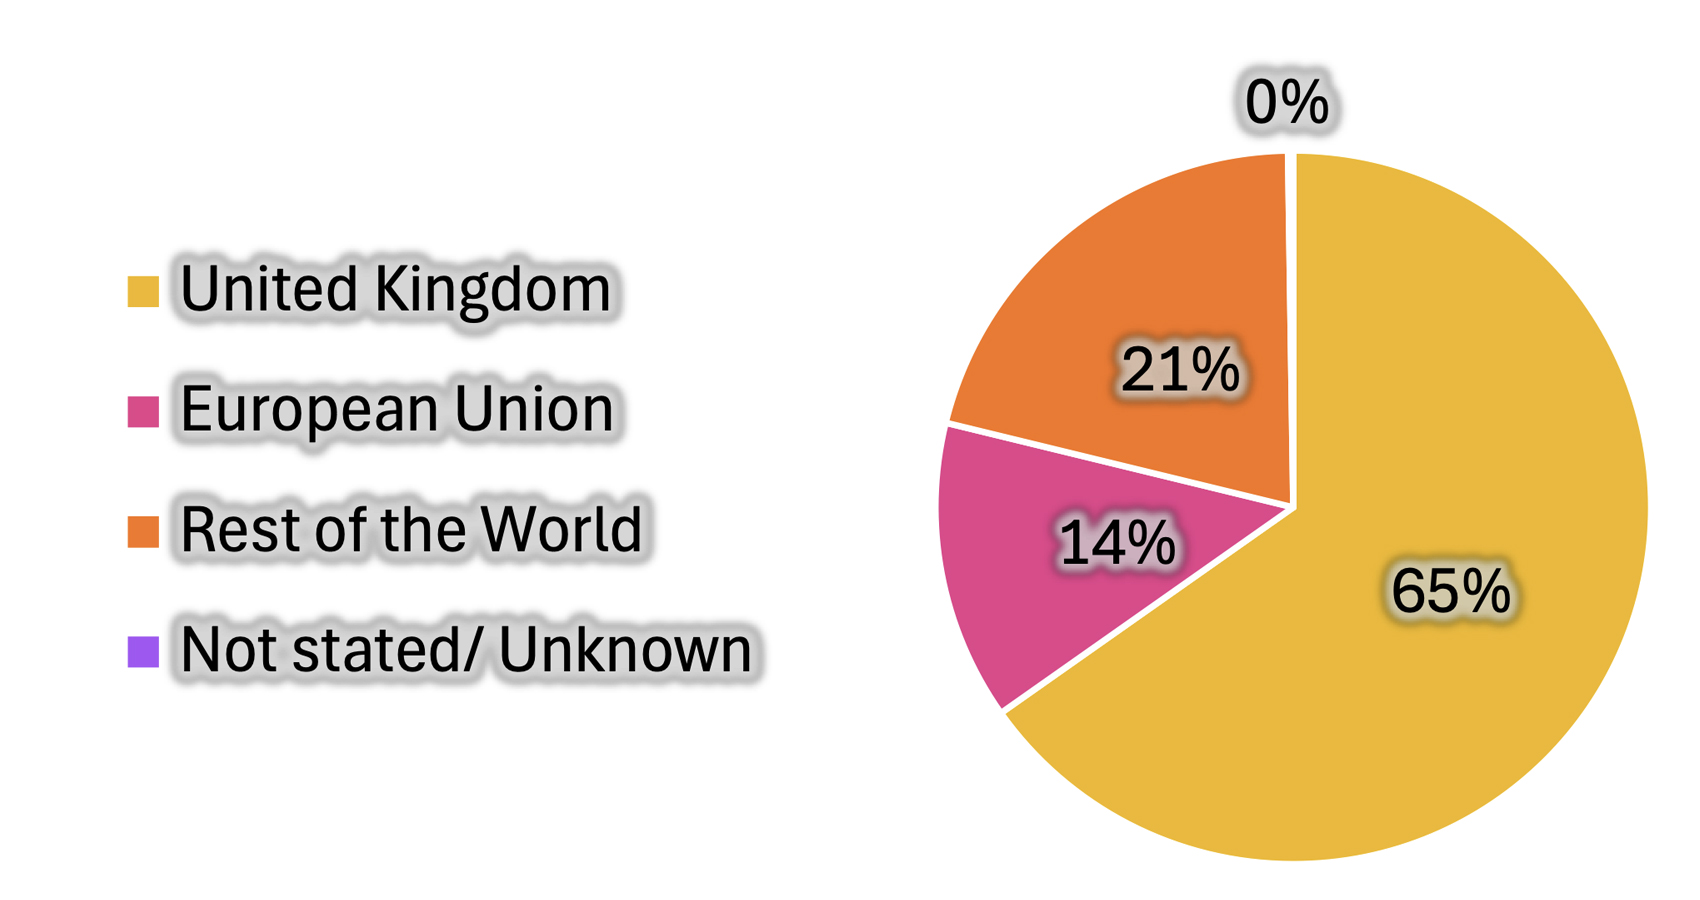
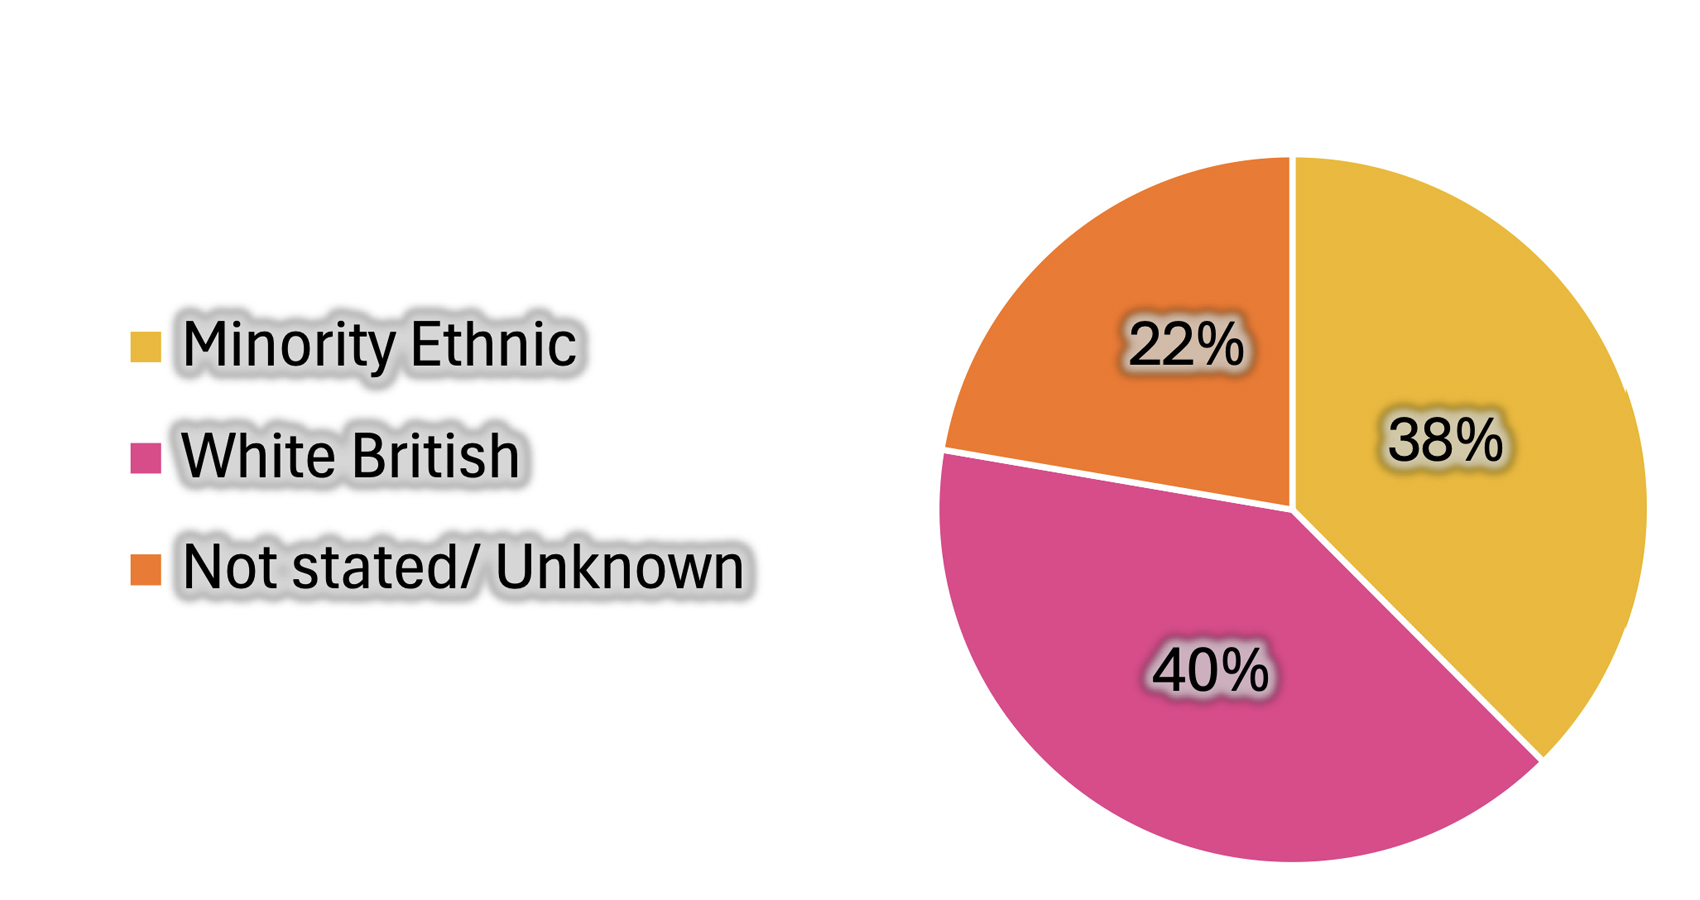
- The workforce is highly international: staff represent 73 nationalities, with 65 per cent from the UK, 14 per cent the EU and 21 per cent from the rest of the world. Scientific roles are twice as internationally diverse (46 per cent) as management and support roles (22 per cent). Among those who declared, it is significant that 48 per cent are minority ethnic. These figures are much more diverse than in the local population,10 showing the significance and importance for our organisation of getting race equity and inclusion right. The difference is increasing with time: since 2018, in terms of nationality, the ‘rest of the world’ group has doubled, from 10 per cent to 21 per cent, and, in terms of ethnicity, we see significant increases in the Asian (from 9 per cent to 15 per cent), Black (from 1 per cent to 4 per cent), Mixed (1 per cent to 5 per cent) and the Other (from 0.2 per cent to 1.7 per cent) groups.
- When looking at the UK population of staff only, compared to the wider population of England and Wales, the Asian, Black and Other ethnicities are under-represented.
- Minority ethnic representation generally declines with seniority, especially for the Black group.
- The majority of applicants are minority ethnic (84.0 per cent) and/or non-UK (73.4 per cent). Despite this, it is notable that the only group who is significantly more likely to be made an offer than their proportion of applicants is the White British group. UK applicants are more likely to be shortlisted, and made offers, than those from the rest of the world. Differences between groups are greater for applicants for management and support roles than for scientific roles.
Actions to consider:
- Ensure visibility of race equity work in the organisation, given the applicability of it to its diverse staff.
- Undertake positive action within Britain, specifically aimed at addressing the Asian, Black and Other ethnic under-representation.
- In particular, for recruitment to senior roles, consider targeting media and imagery specifically to encourage Black applicants. Consider other issues around talent pipeline and retention that may be affecting this group disproportionately.
- Review recruitment processes to consider any practices that create barriers for minority ethnic people, and international candidates, in particular for management & support roles. Include reference to race inclusion and bias in learning for recruiting managers.
3.6 Religion and belief
Data/commentary:
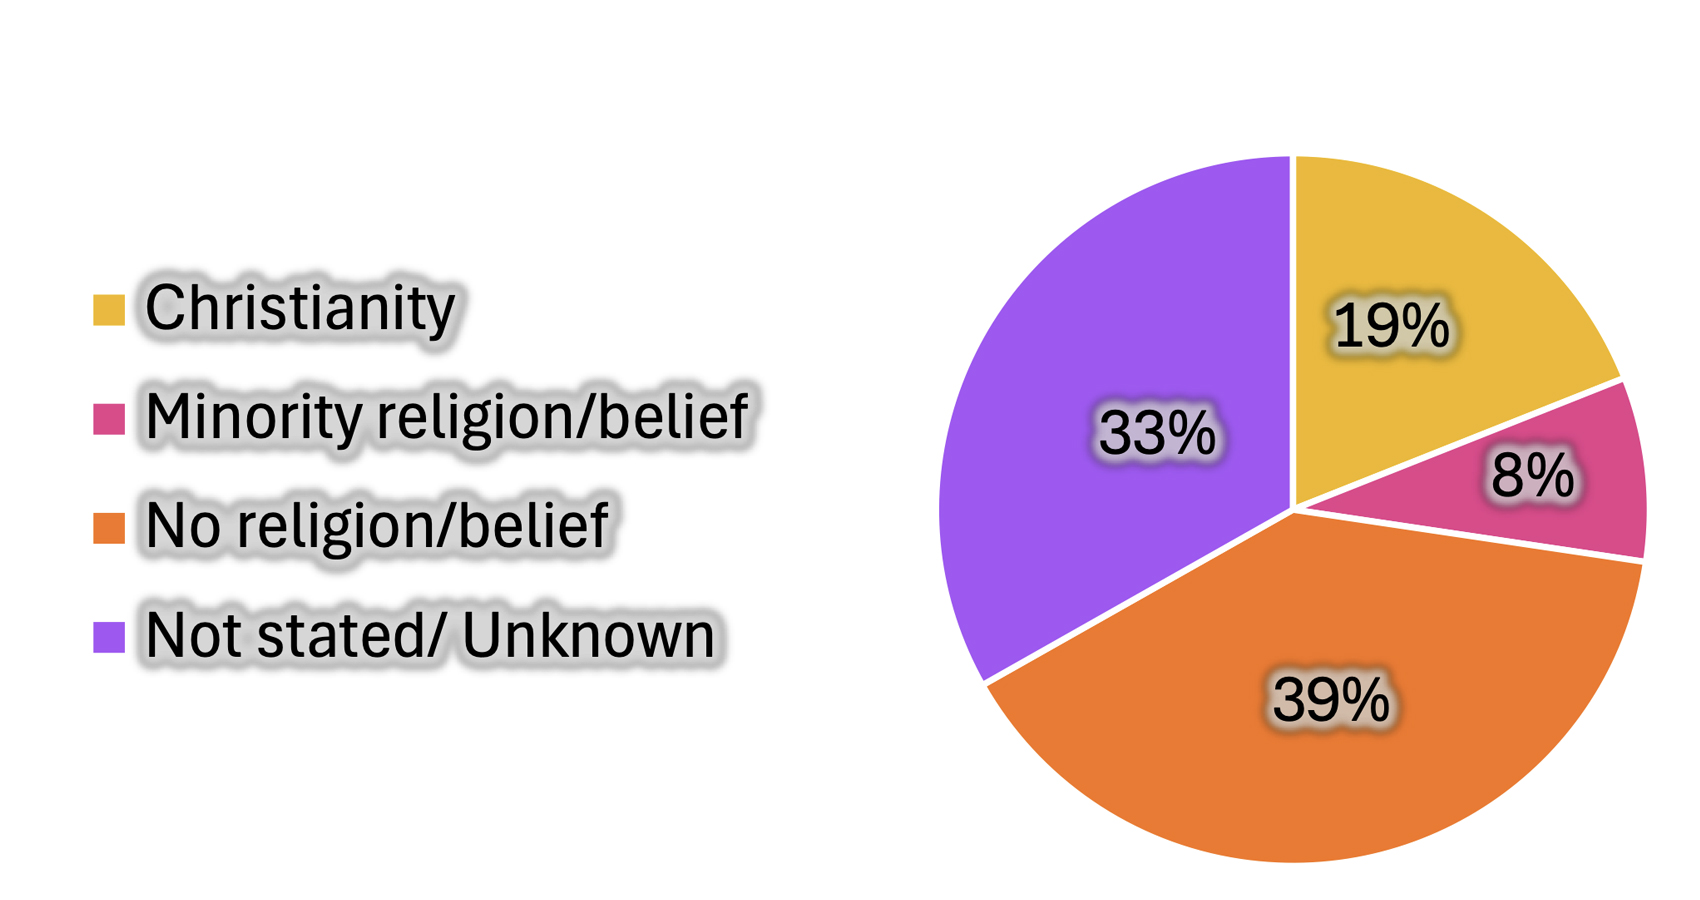
- Perhaps in line with the scientific nature of the organisation, the staff population is largely secular, with only just over a quarter of staff (27 per cent) declaring a religious belief, compared to 60 per cent in the wider population. Of those who disclosed a religious belief, around two thirds were Christian, and a third from other religions. Employees from the rest of world group were more likely to be Hindu, Muslim or Buddhist.
- Since 2018, the proportion disclosing their belief has increased, from 44 per cent to 67 per cent. Considering only those who have specified a religion or belief, those identifying as Hindu have increased proportionately by 70 per cent since 2018, from 3.0 per cent to 5.1 per cent of staff, and Muslims have increased more than fivefold, from 0.7 per cent to 3.6 per cent.
- People of any religion are less likely to be shortlisted or appointed. Due to the overlap with ethnicity and nationality, this is likely to be related to race bias.
Actions to consider:
- &b. Explore what else can be done to support and promote religious inclusion, and the range of faiths and secular beliefs on campus.
- Review recruitment processes to consider any practices that may create barriers for religious candidates. Include reference to religious bias in learning for recruiting managers.
3.7 Sexual orientation
Data/commentary:
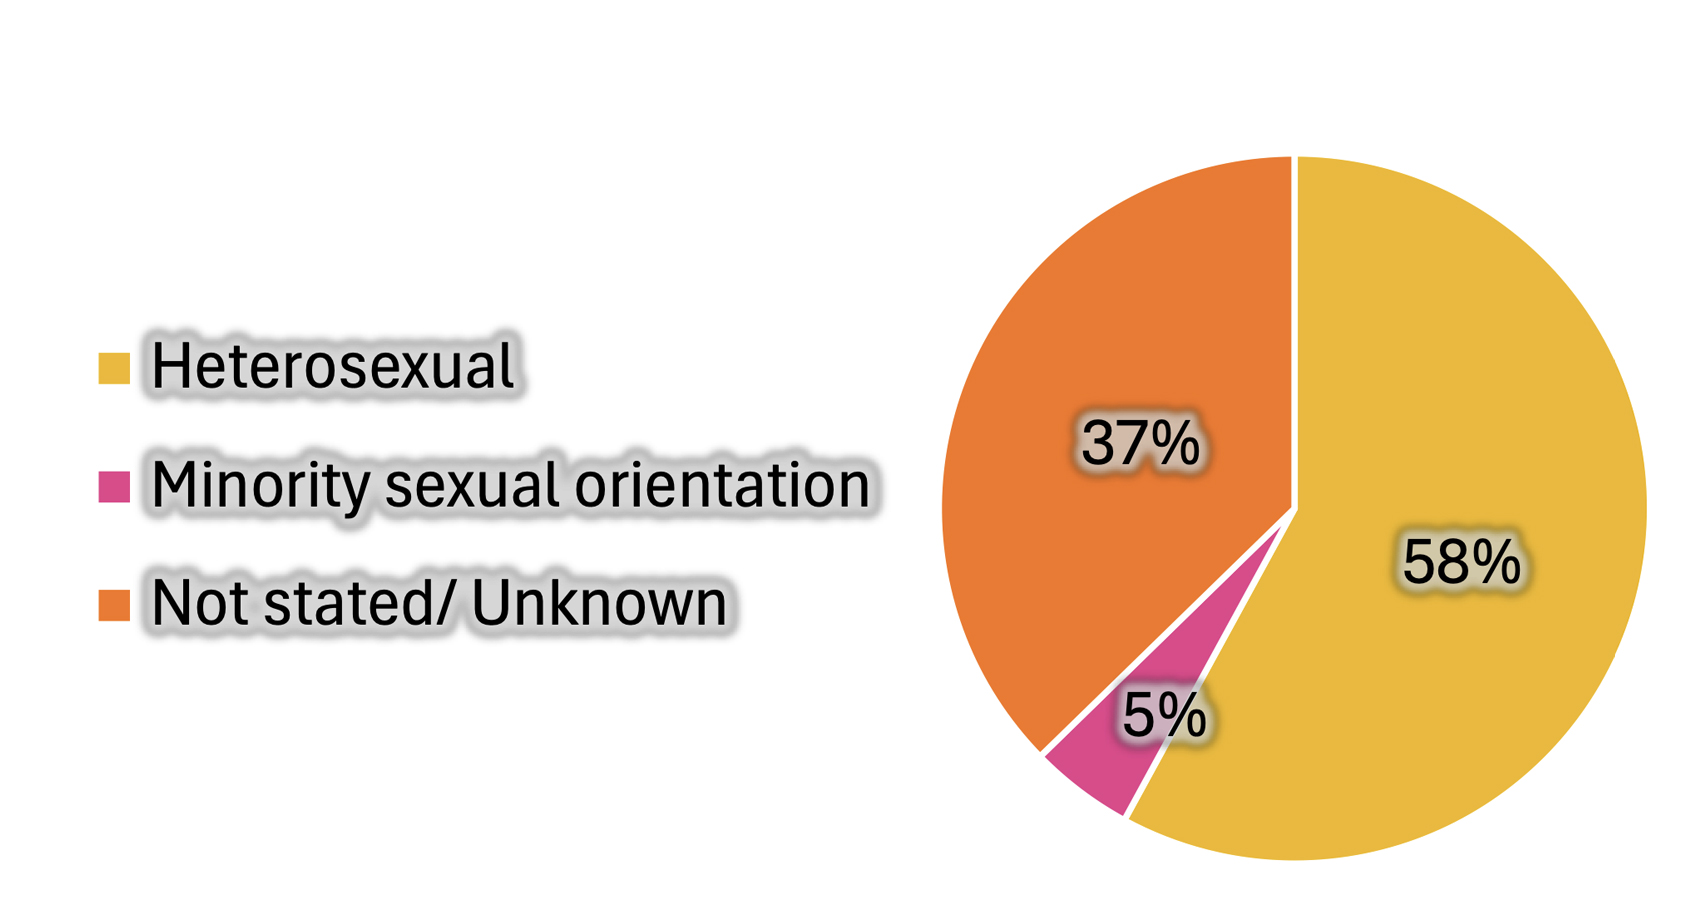
- 4.8 per cent are from a minority sexual orientation (7.5 per cent of those declaring), amongst whom the bisexual group is the largest. This is 50 per cent proportionately larger than the 3.2 per cent recorded in the 2021 census, and more than double that, when considering the known orientation group only. There is a potential significant pipeline from the student population, where 11 per cent disclosed a minority sexual orientation (18 per cent of those declaring).
- Disclosure in this category has more than doubled, to 68.9 per cent in 2025, from 28.4 per cent in 2018. However, of those who declared, those from a minority sexual orientation decreased to 7.5 per cent in 2025, from 8.2 per cent in 2018. This bucks wider trends, where disclosure rates are increasing, suggesting those from a minority may be less comfortable to disclose.
Actions to consider:
- The higher proportion of the minority sexual orientation group highlights the importance of inclusion for the staff group in this area. Bi inclusion in particular is an important theme, which also arose from qualitative data arising from our Great Place to Work staff survey.
- Do more to ensure people from minority sexual orientations feel comfortable to disclose.
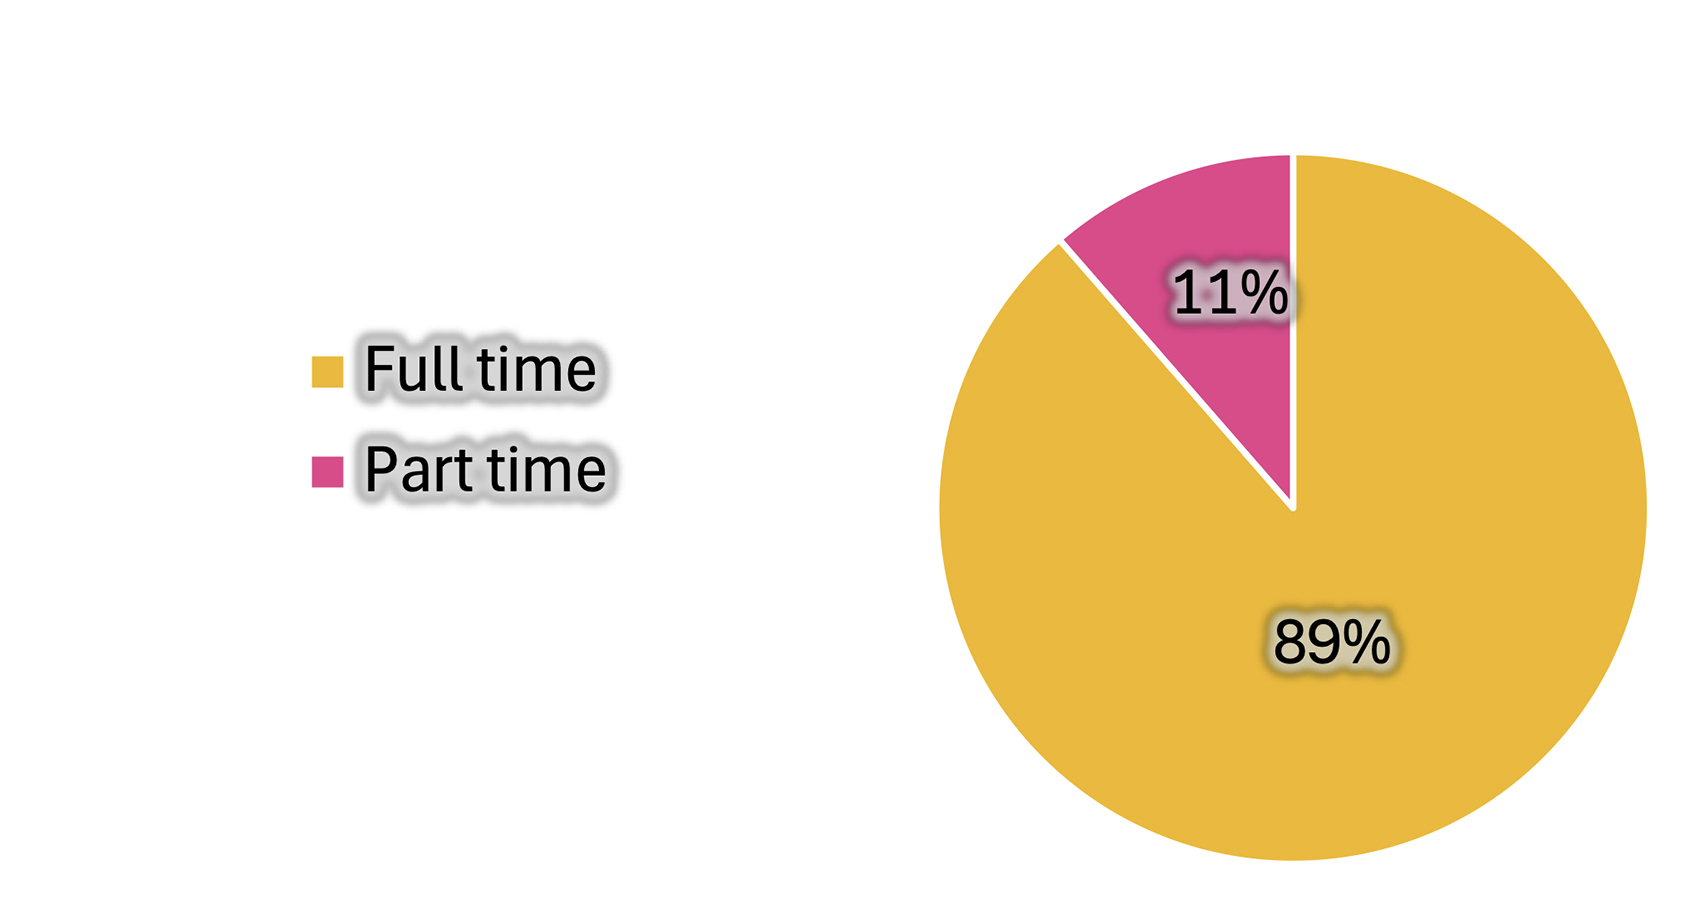
3.8 Working pattern
Data/commentary:
- 4 per cent of employees work part-time, up from 7.2 per cent in 2018. Women are nearly three times as likely to work part-time as men (15.7 per cent vs 5.9 per cent), particularly in management and support roles. In the national population, part-time working is more prevalent, and the disparity gap between women and men is twice, rather than three times (in 2022 nationally, 23.5 per cent of women and 11.4 per cent of men worked part-time).11
- Part-time working rates are higher in more senior roles, which bucks national trends.12
- Female employees in management and support roles are more likely to work part-time (21.8 per cent), than those in scientific roles (10.3 per cent). Male part-time working rates do not vary significantly by role.
Actions to consider:
Do more to promote part-time working, and in particular to break down any barriers to it for a) men, b) those in lower graded roles, and c) women in scientific roles.
3.9 Students
Small numbers mean that yearly fluctuations should be interpreted cautiously. Whilst students do not necessarily become staff, and staff in management and support roles in particular are less likely previously to have been students at Sanger, it is interesting to look at the student data with the lens of a potential future pipeline of talent for the organisation, indicating a potential or likely direction of travel for the future staff demographic.
- As expected, students are concentrated in younger age groups: 84 per cent are aged 21 to 30.
- 8 per cent declared a disability, more than in the staff population (6 per cent). This mirrors national trends of increasing awareness and disclosure around disability for younger generations.13
- 65 per cent were cis, 1 per cent trans, non-binary or gender diverse, and 34 per cent did not declare. Despite demographic trends that show younger people are more likely to declare being trans, non-binary or gender diverse,14 the rate of disclosure (66 per cent) was actually less than for staff (70.8 per cent). More may need to be done to enable students to feel safe to disclose their gender identity.
- 46 per cent of students were female and 54 per cent male. This does not match the staff population, which is 56 per cent female. Some examination of processes for attracting and processing student applicants is recommended, to ensure against bias in favour of male students, in particular for the 2025 cohort, as there was a drop in that year.
- The student cohort is highly international and more globally diverse than the staff. 25 per cent are from the UK, 17 per cent from the EU, and 58 per cent from the rest of the world. This mirrors staff trends over time, which show an increasing population from the rest of world. There may be scope to do more student recruitment from the local British population.
- Among those declaring their ethnicity, it is notable that 87 per cent identify with minority ethnic groups, including 30 per cent Asian, 11 per cent Black, 4 per cent mixed, 9 per cent other and 34 per cent White Other.
- 30 per cent of students reported no religion, 11 per cent Christian and 16 per cent other religions. The profile mirrors the cohort’s international composition.
- Of those declaring, 18 per cent identify with a minority sexual orientation, a much higher proportion than in the wider staff (7.5 per cent of the known, of which the student rate is more than double) or national population15 (3.2 per cent, so the student rate is around six times higher). This should then be an area of focus, in terms of making these students feel welcome, included and heard.
Footnotes:
5. The reason legal sex is referenced in this way is that all staff will be categorised in a binary way, according to legal sex, which meets HMRC requirements. However, in accordance with best practice around trans inclusion, and as signatories to the Athena Swan Charter, the Wellcome Sanger Institute has already expressed its support for, and recognition of, people of all genders, and commitment to the principle of self-identification. We recognise that people’s legal sex and gender may not be the same.
9. Categories used are as per the England and Wales census, which enables comparison with the wider population.